


Is Curve v2's Tricrypto Pool worth getting into?
Exploring Curve's latest Tricrypto v2 Pool


What is Curve v2 Tricypto?
When Curve launched, it rose to fame as the AMM for ‘like-assets’. Swaps between stablecoins (USDT, DAI, USDC, UST) and similar assets (renBTC and wBTC) incur very low fees with close to zero slippage. In an effort to expand the use case for Curve, they recently launched Curve v2, introducing swaps between volatile assets with the Tricrypto pool being one of them. This pool is a 3-way pool between WBTC, WETH/ETH and USDT allowing users to swap freely between any of the 3 assets.
In this piece, I’ll dive deep into what the usage has been like for the Tricrypto pool covering liquidity, swap volume and trading trends.
Liquidity in Tricrypto
To calculate the net liquidity of the pool, I took the USD amount for each asset that is added to provide liquidity to the pool and deduct by the amount that is removed from liquidity.
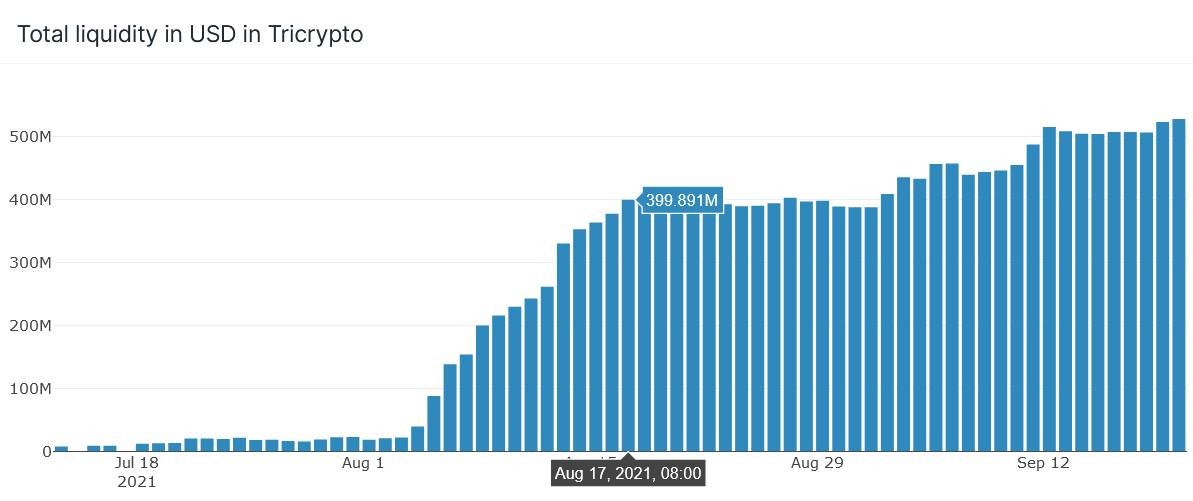
Since its launch in early August, the pool managed to amass about 400M USD in liquidity in the span of just 2 weeks! However, upon reaching its local peak, liquidity was increasing at a much slower rate. After a month since being at the 400M USD mark, the pool now has 530M USD - which is still substantial but the growth has visibly slowed down.
When we look at the distribution of assets in the graph below, we can see how the pool tries to balance out the assets in the pool equally as what AMMs usually do.
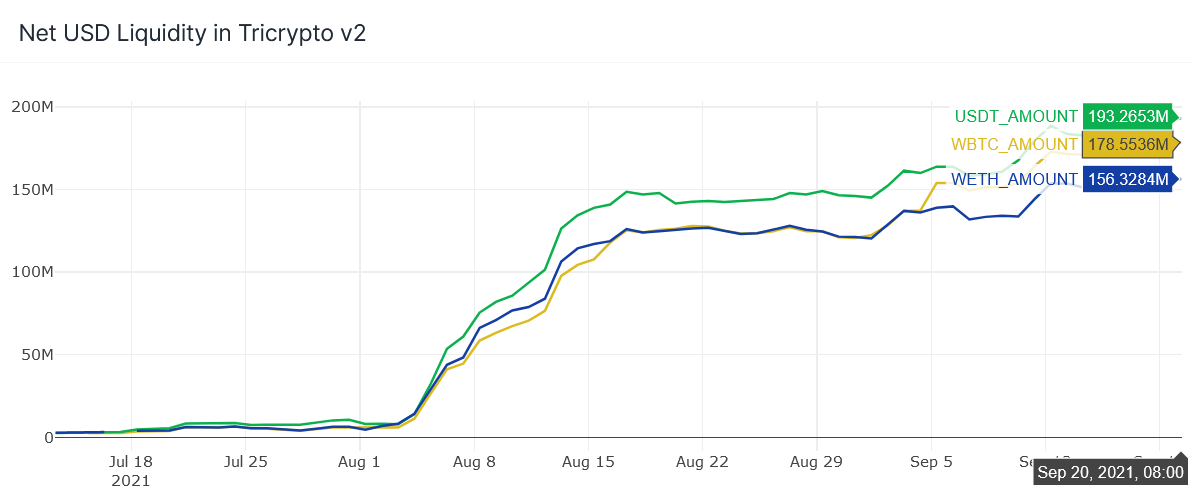
A graph showing the breakdown of the 3 assets denominated in crypto can be found here: https://velocity-app.flipsidecrypto.com/velocity/visuals/cf309615-8913-493c-8003-a3e9c66efc54/c0393724-4a87-44ff-9cd8-0fe34def15ec .
Swap Volume
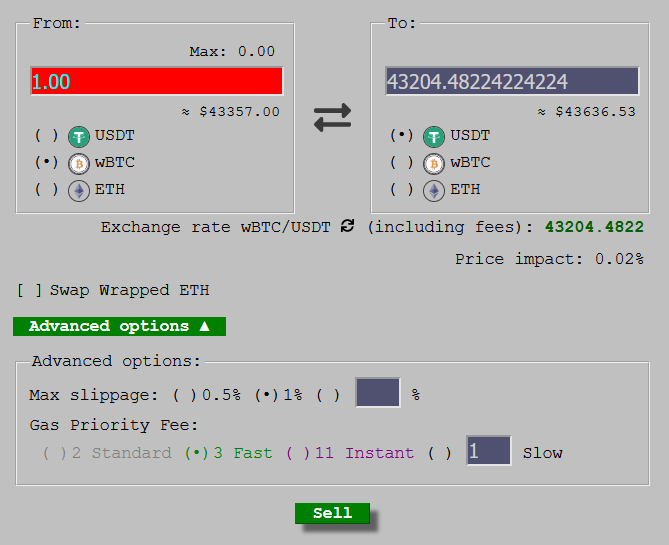
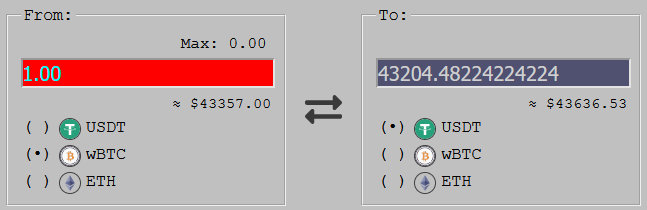
Next, let’s look at the daily swap volume for the pool. Recall earlier that one can swap between any of the 3 assets. Below is a screenshot taken from the Curve.fi website showing how the swap works.
To calculate swap volume, I simply take the sum of value of the asset is offered in USD.
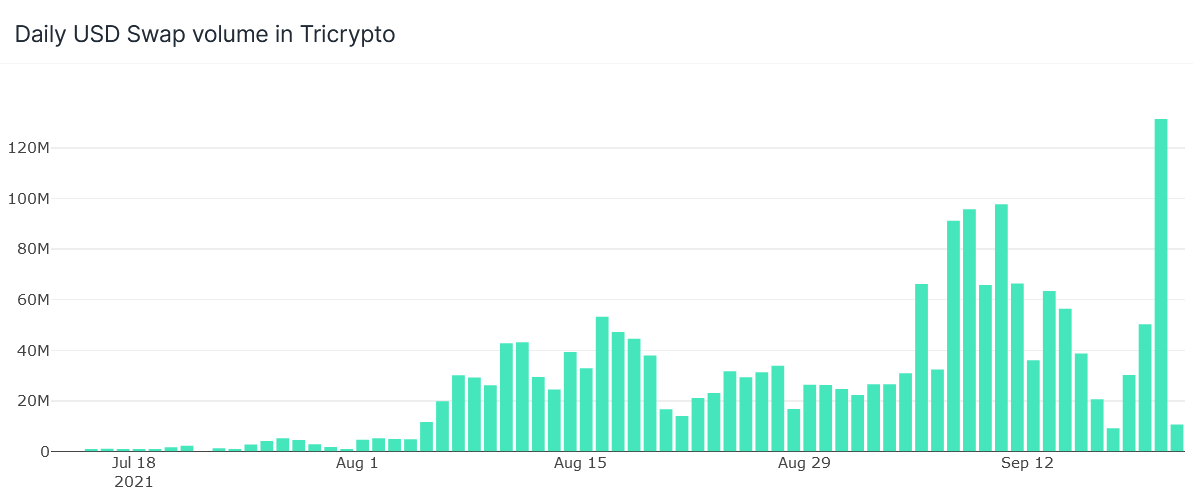
The graph above shows how swap volume has been consistent around the 20M-40M range on a daily basis up until end of August. Then, there are higher spikes in the recent weeks, which is most likely contributed by selling or buying of assets as markets take another price dive.
A good way to tell if it’s worth providing liquidity is by comparing the ratio of swap volume to amount of liquidity. If a pool has high liquidity but low swap volume, the fees you receive, which are divided proportionally to the liquidity you provide, would be less as compared to providing liquidity to a pool with low liquidity but high swap volume.
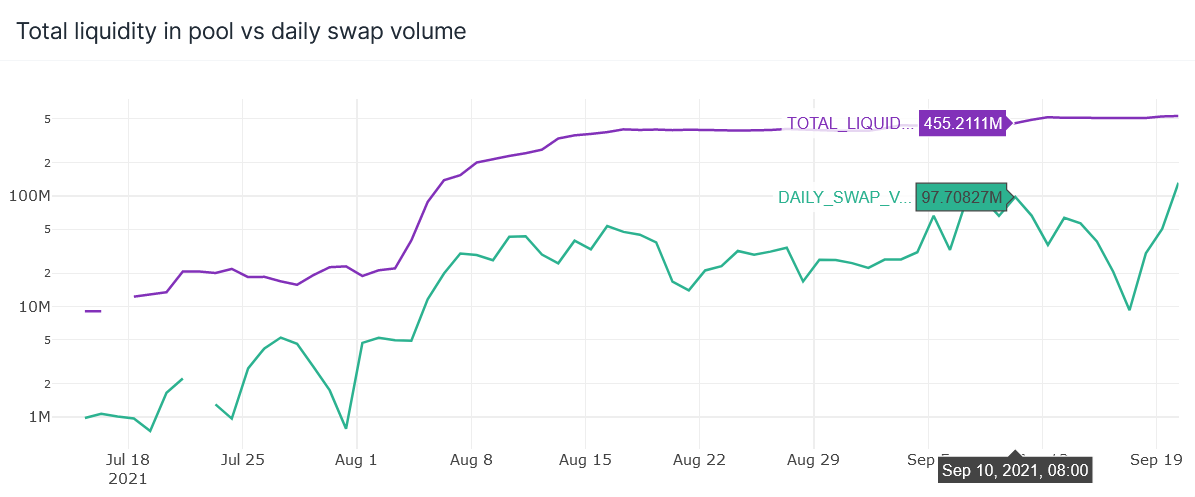
In the graph above, I plotted the daily swap volume with the total liquidity. We can see that the daily swap volume actually kept up with the pace of liquidity added. The swap volume also remained consistent in the range of about 20M to 40M with a few 90M spikes on some days.
This is a good sign to me because it shows me the pool is still active and the high liquidity does not dilute the fees received too much.
Number of traders and transaction
Besides swap volume, we should also look into the number of traders and transactions to get the full picture. Consider a situation where daily swap volume is primarily driven by 1 whale. If this whale were to leave for another platform, the daily swap volume plummets and so does the fees received from providing liquidity.
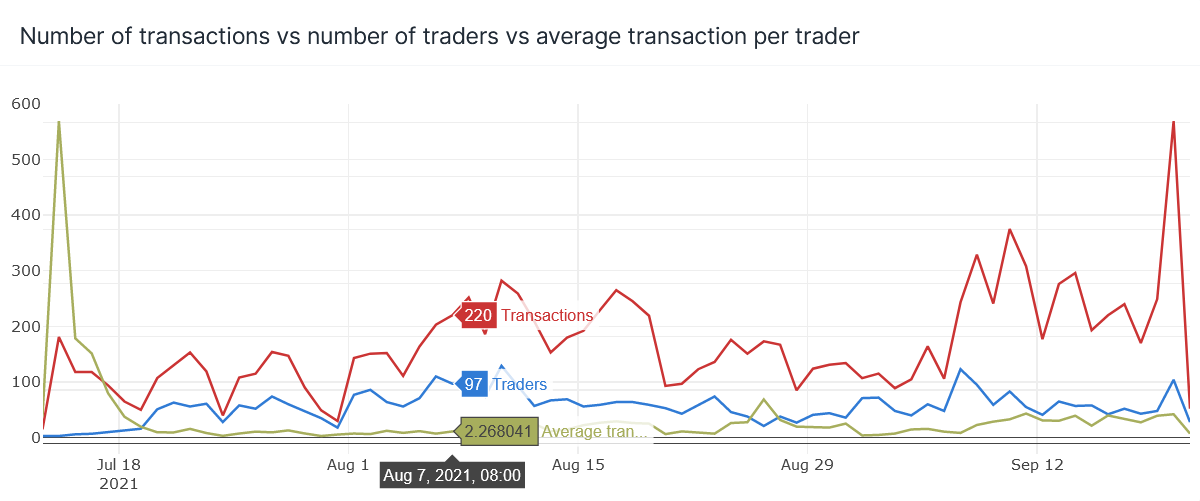
From the graph above, we see that the daily transactions fluctuate anywhere between 50 to 300 transactions a day, with a recent spike of close to 600 transactions (which is again, likely due to the recent market correction).
The number of traders who swaps using this pool is about 50 - 100 a day. This brings the daily average transaction a day to be about 2 - 4. An interesting observation here is that although there were about 600 transactions on Sept 20, the number of traders was at a low 104 which gives an average of 6 transactions per trader on that day!
Assets that are swapped from and to
I wanted to also see what assets traders are swapping from and to. As we see from the Curve UI below, swapping from is the LEFT side of the trade while swapping to is the RIGHT side of the trade. Curve also allows either ETH or WETH to be swapped.
For the first graph below, I’m showing assets from the LEFT side of the trade.
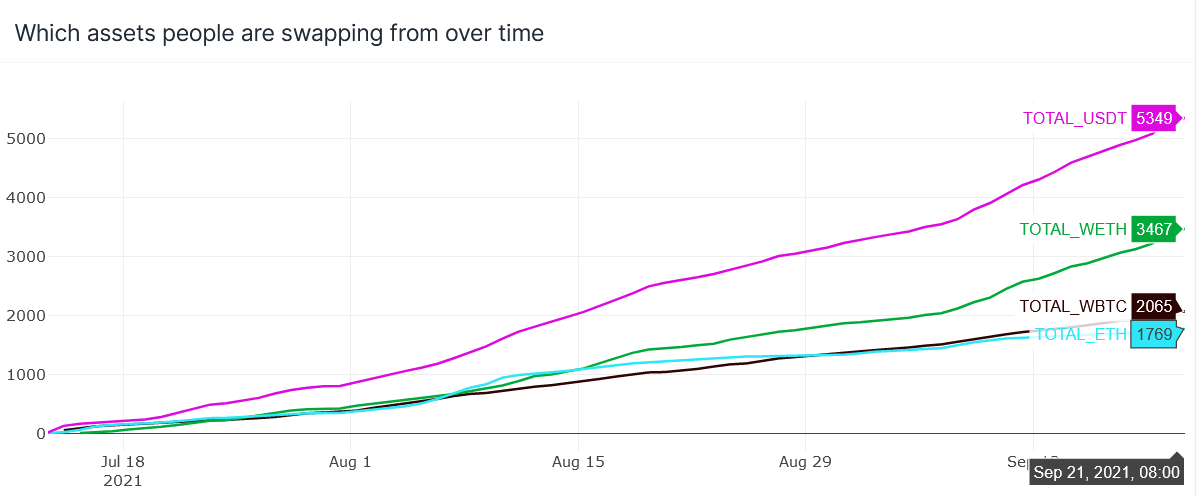
The graph shows that USDT is the main asset people are using to ‘buy’ WETH, ETH or WBTC. However, if we add WETH and ETH that gives us 5236 times ‘ETH’ was used to swap for another asset.
Similarly, I plotted the graph below for the RIGHT side of the trade
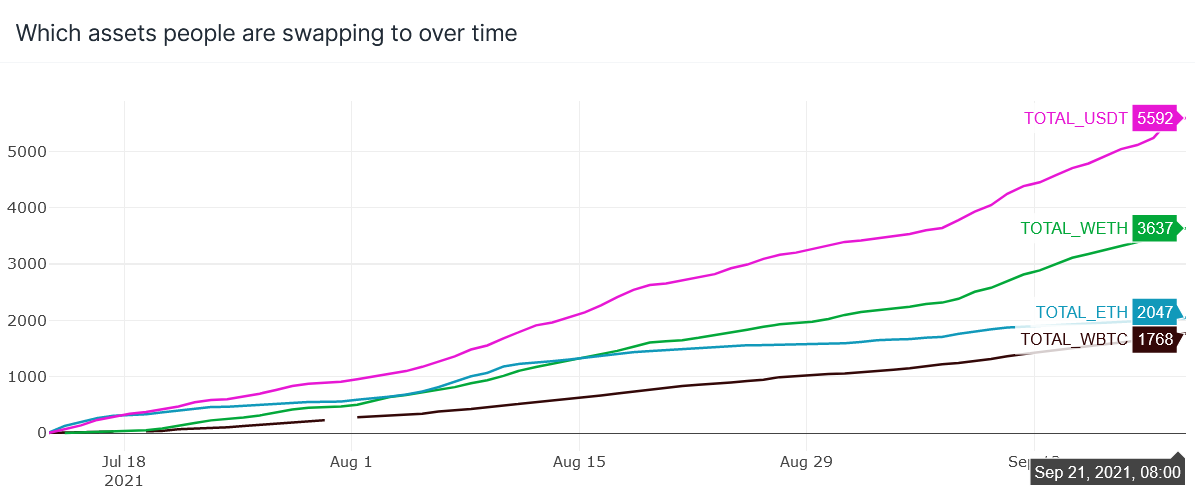
We see a similar trend where USDT is top followed by WETH+ETH. If we counted ETH as one, ETH would have been the number one asset traders are swapping into, 3 times more than WBTC.
A high USDT and ETH in both charts combined with the fact that WBTC was the least asset traded in both charts suggest that buying and selling ETH is a popular use case for the Tricrypto pool.
My hypothesis for why WETH/ETH is so popular is because this Curve data is in the Ethereum mainnet and hence there is just simply more use cases for ETH as compared to WBTC - like paying for fees or NFTs.
In Conclusion
Looking at the data above, it does concern me if I were to provide liquidity for the Tricrypto pool. If we take a conservative 100 traders per day and swap volume of 20M, this means each trader is swapping volumes of up to 200k USD a day. This suggests to me that whales are primarily driving the swap volume and activity for this pool. If they were to suddenly opt for a different platform, this would affect fees by a lot.
However to be fair, the volume has been proven to be consistent for almost 2 months with no sign no reduced in pool liquidity and this is a good sign to some.
Having said that, my final verdict is I would use the pool to swap between assets but I wouldn’t provide liquidity for now given the uncertainty that the ‘centralized’ activity of the pool brings.
Great analysis. How will your conclusion be impacted the LP rewards that will kick in soon?